New interest unlocked: Spatial Data Science

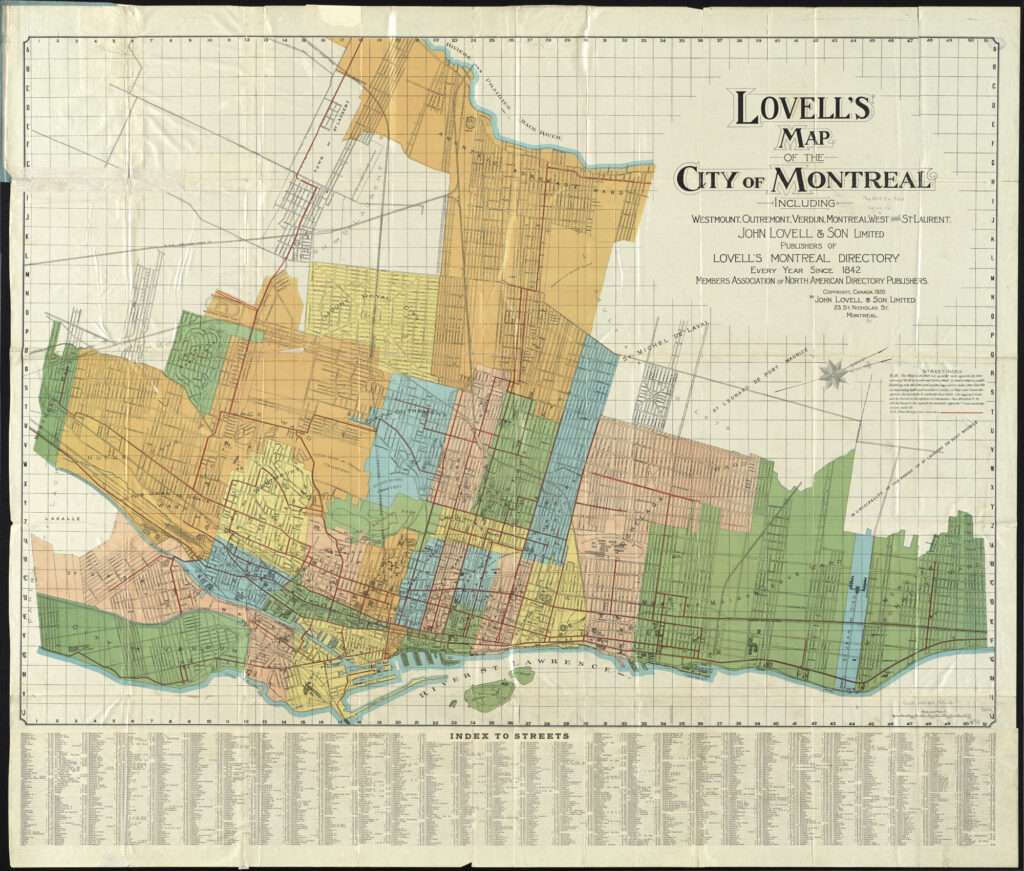
A cool map of Montreal, QC, Canada. “Lovell’s map of the city of Montreal : including Westmount, Outremount, Verdun, Montreal West and St. Laurent” by Norman B. Leventhal Map Center at the BPL is licensed under CC BY 2.0.

A few months ago I attended the Spatial Data Science Conference in New York City, hosted by Carto.

Spatial Data Science is a field that deals with spatial data – that is, data points that have a geography associated with them. For example, a database of sales by ZIP code would be spatial data. In the planning world, spatial data tends to show up in conjunction with GIS (Geographic Information Systems), the most prevalent of which is ArcGIS (and its open-source equivalent, QGIS).

In college, I worked for a semester at the maps library at the University of Michigan. I like maps, and spatial data, so when I found out about this conference I was excited to see how spatial data was used in industry.

I will have to type up my notes from the conference in a different post, but I’m writing this post because I want to learn more about spatial data science. I’m ~manifesting~ this by writing about it, hoping that it will keep me accountable. Back in 2023, I wrote about GIS being one of the three technical skills I wanted to learn.

Here are some things that interest me about spatial data science, that I would like to learn. I don’t have a plan or goal associated with this yet, because I want to make sure that anything I commit to is realistic (which I haven’t done the greatest job of doing in the past…oops).
Things I want to learn about Spatial Data

Creating a frequency map for my local transit agency, CARTS, part 1 – Analyzing frequencies

1. Introduction

Anyone who knows me knows that I’m a huge transit nerd. Lately, I’ve been trying to deepen my understanding of transit by challenging myself to work with and analyze transit data. To do that, I’m working on a side project to build a Jarrett Walker style transit frequency map for my hometown transit agency, Chautauqua Area Regional Transit System (CARTS). Ultimately, I’d like to perform a scaled down version of an Operational Analysis, using the Akron bus redesign as a reference. Then, I’d like to use that data to propose updates to CARTS that could help to reverse the trend of declining ridership.

I’ll start by outlining why transit service is important, and then sharing the results of my analysis of frequencies. In the appendix, I’ll share how I arrived at these figures, and my next steps in this project.

2. Background

a. Good transit is important for poverty reduction

First, we need to understand why good transit is important.

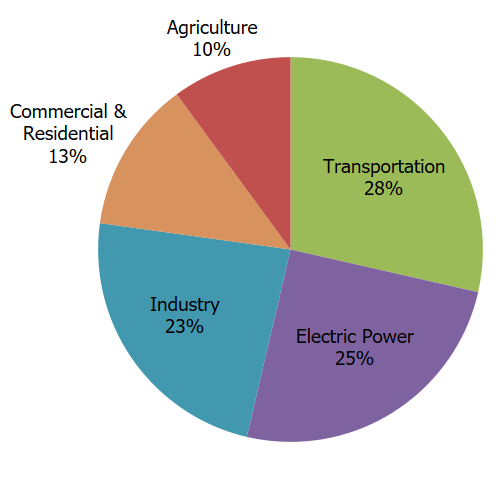
Effective public transportation is an effective way to bring households out of poverty and is a critical method of reducing carbon emissions in a country where transportation is the largest source of carbon emissions.

Total U.S. Greenhouse Gas Emissions by Economic Sector in 2021
Source: https://www.epa.gov/ghgemissions/sources-greenhouse-gas-emissions

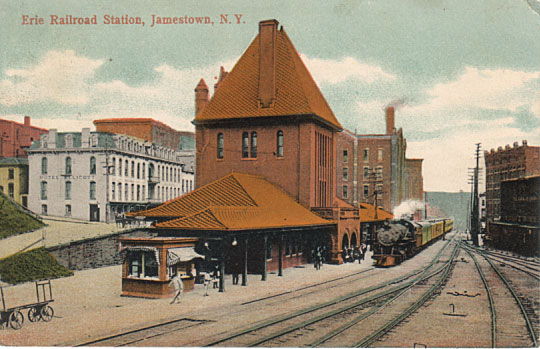
In Chautauqua County, the link between transportation and poverty reduction is quite clear based on a study commissioned by the United Way of Southern Chautauqua County. The study looked at the City of Jamestown, which is the largest city in the county and the anchor of the South County region.

Breaking down my technical skills goals – Full-stack

Me hacking the mainframe after learning all these technical skills. Source: “Hacker Stock Photo” by devdsp is licensed under CC BY 2.0.

In this post, I talked about the three technical skills I wanted to learn: SQL, Full-stack, and QGIS. In this post, I talked about some things I’ve accomplished. Today, I’m going to break down my full-stack learning goals to hold me accountable.

Course Breakdown and Pacing

This course has 13 parts. Each part is supposed to take around 15-20 hours, or about a week. I’m working part-time until June 9th, so until then I’ll plan on doing one part a week, with a week buffer.

After June 9th, I’ll plan on doing 1.5 parts per week, since I won’t be working and will have more free time.

For Part 1 – 4, I’ll consider each section complete (and will not move onto the next section) after I’ve completed all of the non-starred exercises, as per the course instructions. For the remainder of the sections, I’ll consider a section done when I’ve done 75% of the exercises.

Based on that pacing, here’s what I should accomplish each week:

Technical skill learning update: switching to projects

A few weeks ago, I wrote about how I wanted to learn three new technical skills this year. The reason I want to learn these skills is that I’ve identified roles that interest me that require these skills.

In this article, I’ll share my progress on these goals, the obstacles or I’ve faced, and some solutions I propose to address them.